

Mapping Brain Activity of Patients with Smell Dysfunction
We
then proceeded to perform another series of studies in patients with smell
loss.
Purpose: Our
next goal was, to use functional MRI (fMRI) to develop an objective, noninvasive
technique by which patients with smell loss could be identified, their
abnormalities quantitated, their results compared to findings in normal
subjects and visual representation of their central nervous system (CNS)
pathology obtained.
Methods: fMRI brain scans were obtained
in eight patients with hyposmia in response to three olfactory stimuli
(pyridine, menthone, amyl acetate) in three coronal brain sections selected
from anterior to posterior temporal brain regions using multislice FLASH
MRI and results were compared to similar studies performed in 17 normal
subjects. Activation images were derived using correlation analysis and
ratios of area of brain activated to total brain area were obtained.
Results:
Brain activation to each stimulus was lower in each section in patients
compared to normal subjects and reached statistical significance for mean
activation for each odor and in six of the nine individual sections studied.
Activation in patients was found in regions previously associated with
CNS processing of olfactory stimuli in normal subjects but activation
in patients was much less, particularly in inferior frontal and cingulate
gyral regions of frontal cortex and in regions of medial and posterior
temporal cortex.
Conclusion: These results demonstrate
quantitative CNS changes in smell function in response to olfactory stimuli
in patients with hyposmia, demonstrate a novel, objective method by which
these patients can be identified and provide maps of the CNS changes associated
with their smell loss.
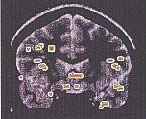
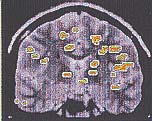
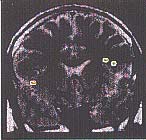
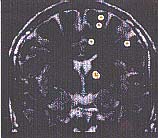
In the accompanying photograph we compared the response to pyridine in
a representative normal subject (top, 22y woman) with that in a representative
patient with allergic rhinitis (bottom, 37y man). This vapor induced the
greatest degree of activation in both normal subjects and patients with
hyposmia, Three brain sections, anterior, middle and posterior are shown
from left to right. In the normal subject, activation is observed
in each section. Anterior section: activation observed in frontal
cortex, bilaterally, in the posterior medial orbitofrontal cortex and
in the left temporal tip; Middle section: activation observed in
the frontal cortex, bilaterally, in the right cingulate cortex and in
the temporal cortex, bilaterally; Posterior section: activation
observed in frontal cortex, bilaterally, in the left cingulate cortex
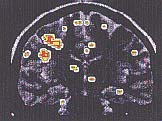
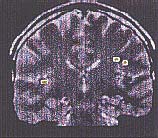
and near the left hippocampus. In the patient, activation is observed
in each section but markedly less than that observed in the normal subject.
Anterior section: activation observed in frontal cortex, bilaterally,
but there is no inferior frontal cortex activity; Middle section:
activation observed only in left frontal cortex; Posterior section:
activation observed in posterior frontal cortex, bilaterally and at the
posterior portion of the right insular cortex. The yellow-red color of
activated areas reflect a continuum of activation over a range of correlation
coefficients from 0.7 (yellow) to red (to 1.0).
| 22-year-old woman | |
 |
 |
 |
|
| 37-year-old man | |
 |
 |
 |
|
- Mapping
Brain Activity of Normal Subjects
- Partial list of Dr. Henkin's research papers on the problems and cures associated with loss impairment of the senses of taste and smell.
Home
| The Clinic | Diagnosis
| Treatment | FAQ
| Press
Research
| Clinical Overview
| What's New | Contact
Us
The descriptions
on this site are for informational purposes only and are not intended to substitute
for professional medical diagnosis and/or treatment.
If you have further questions, please contact the Taste
and Smell Clinic directly.
All material at this domain copyright © 2000-2022 the Taste and Smell Clinic.